GIS PORTFOLIO
Here you will find some selections of my GIS work. They range from remote sensing to spatial analysis to even Story Maps!
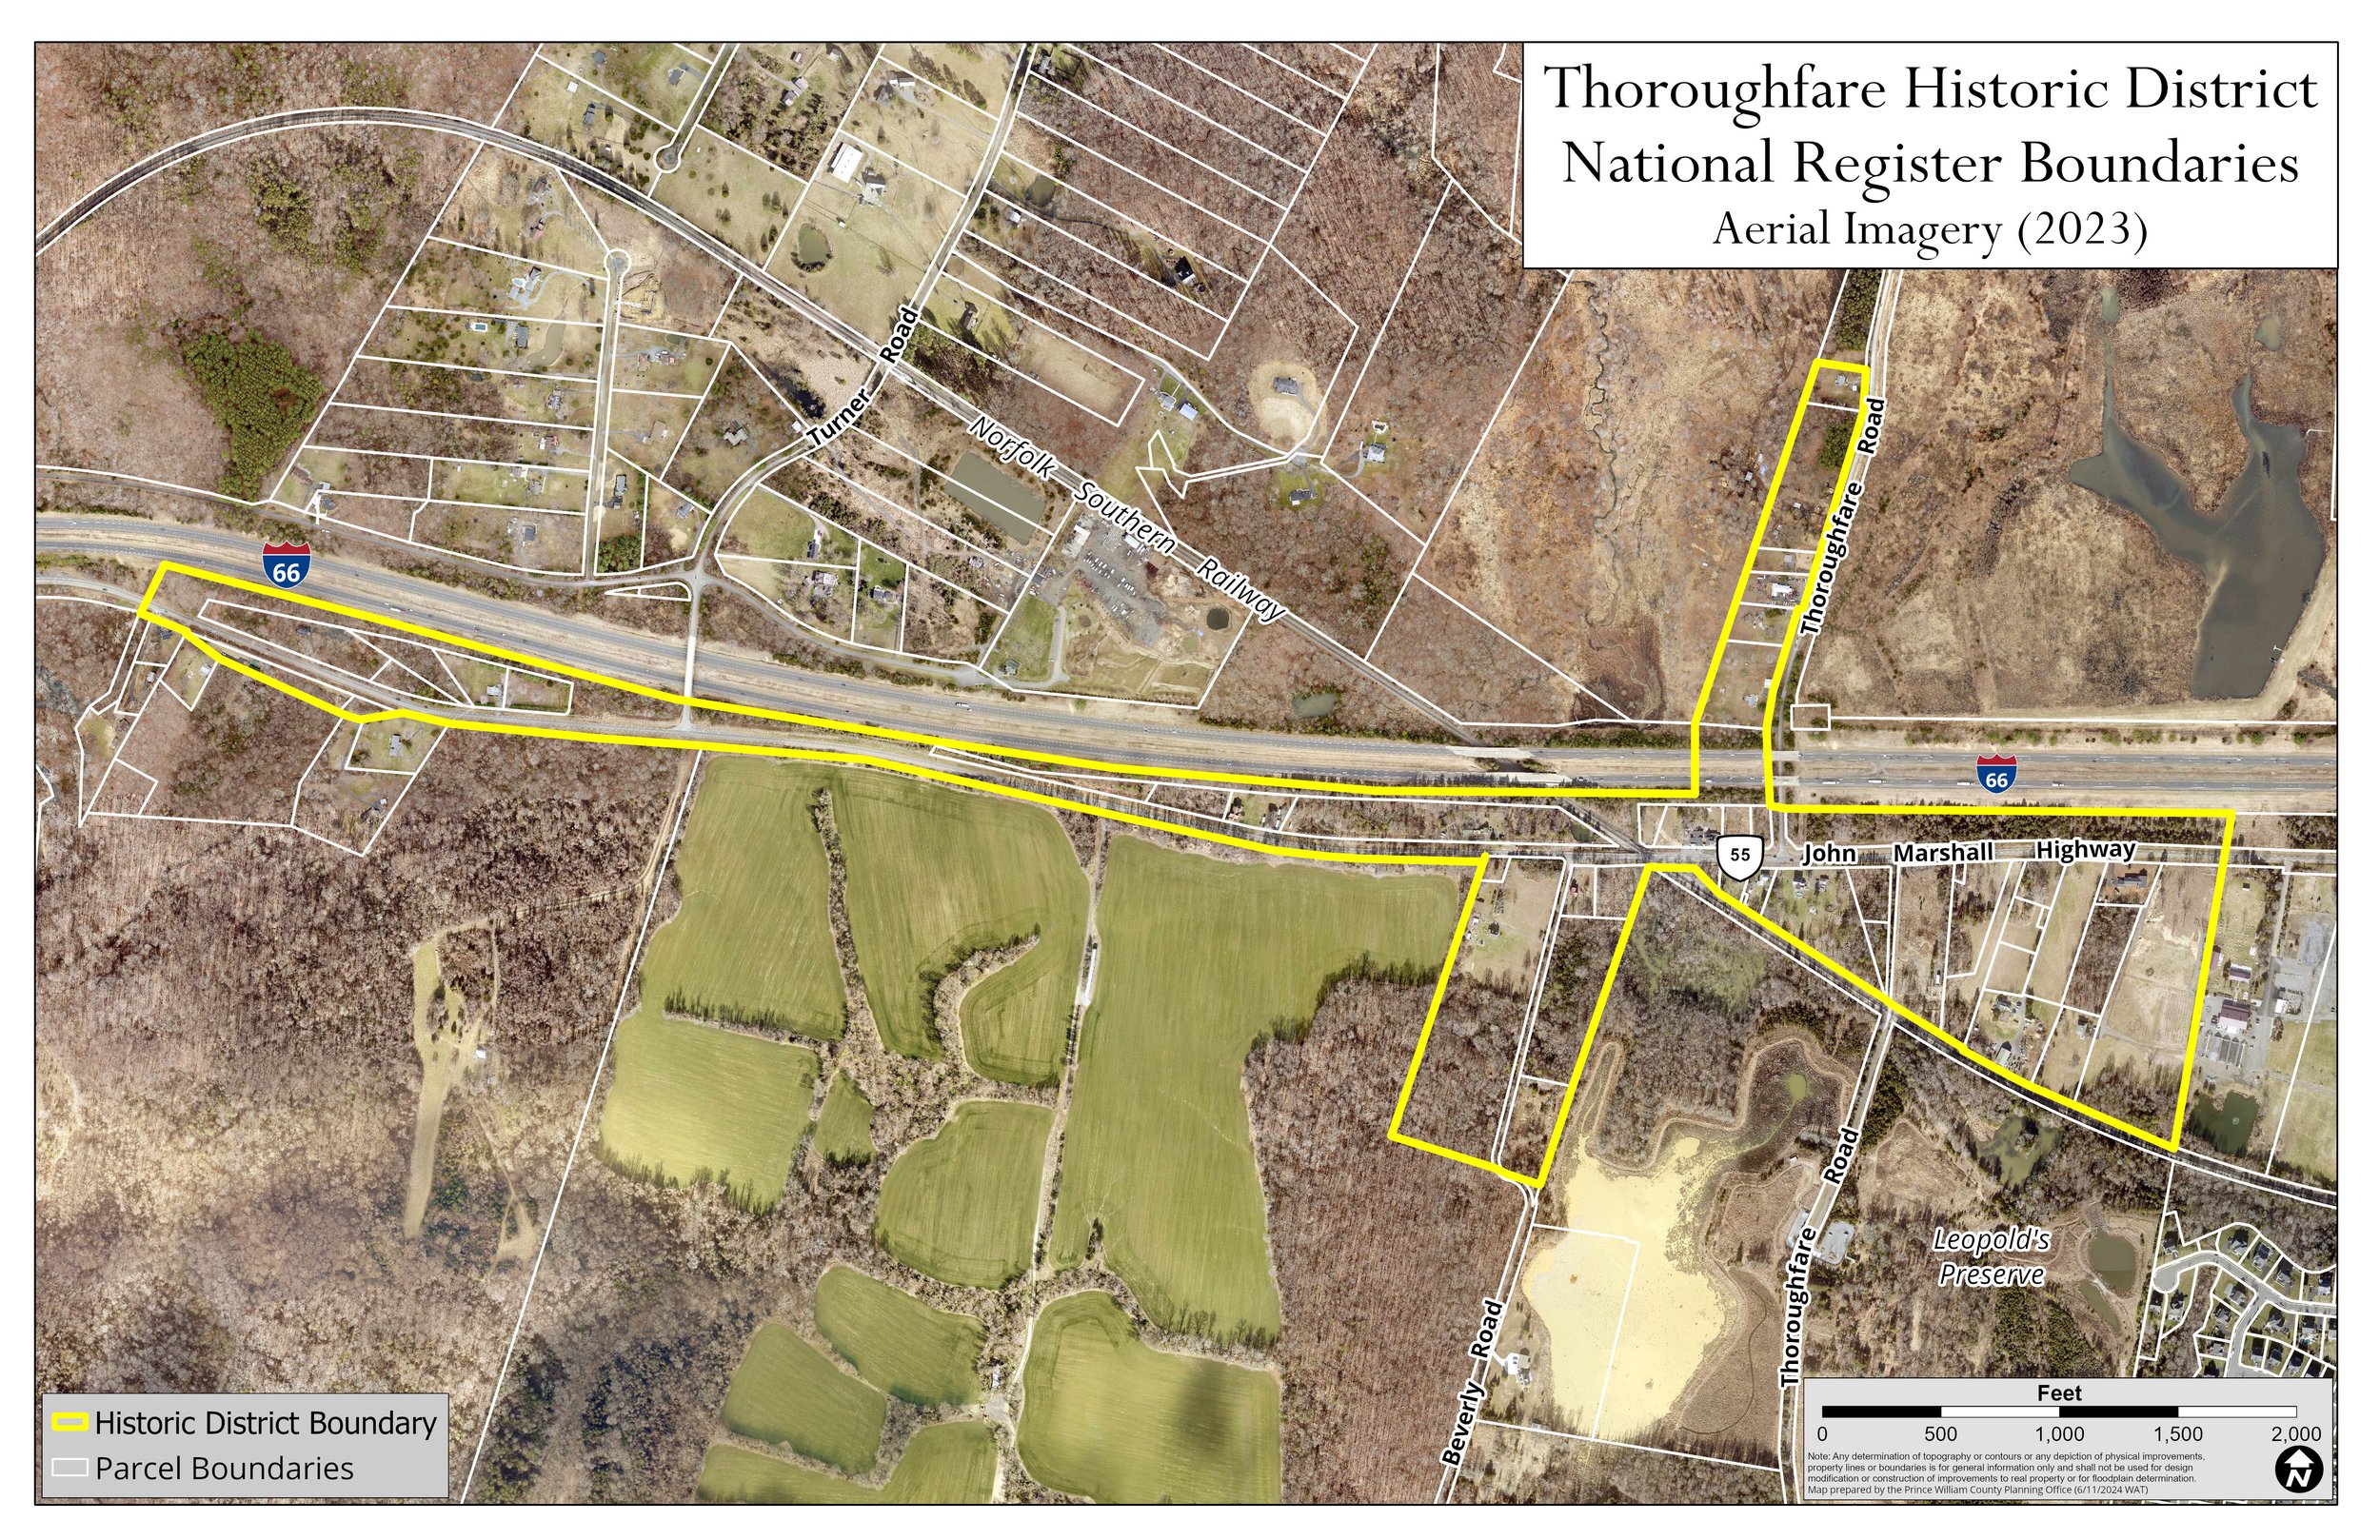
During my internship with the Prince William County Planning Office in summer 2024, I was given the task to create some maps as part of the ongoing process to create a National Register Historic District of the Thoroughfare area in the western part of the county - this map shows the proposed boundaries of the district.

This map was part of my capstone project for my GIS Certificate, which was an analysis focused on Virginia's wine industry. Here, all vineyards within the state are mapped, and the boundaries of each county is included for clarity - 392 vineyards in total!
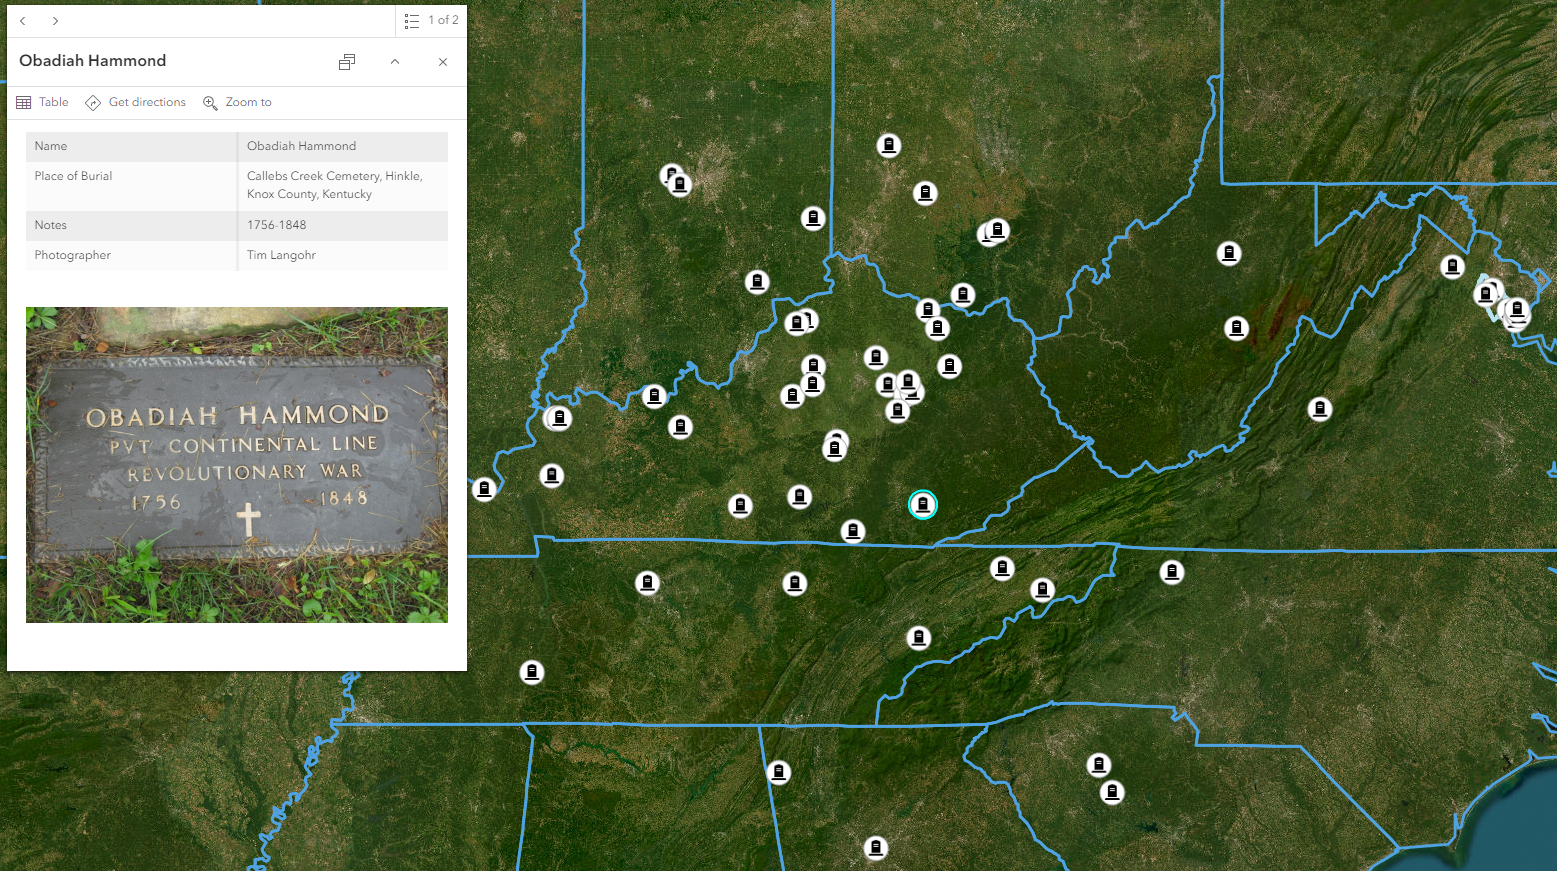
This is a screenshot from a smaller project I was involved in towards the end of my internship with Prince William County - I was connected with the intern in the Historic Preservation Office who was tasked with creating a roster of Revolutionary War veterans connected to the county, whether they were born or enlisted there. During this research, she produced a list of burial sites for these veterans. I was asked to produce a web map showing them - each point has information about its respective veteran include years of birth and death, address of burial, and any noteworthy events during their lives such as involvement in certain battles. Click the image to view the map!
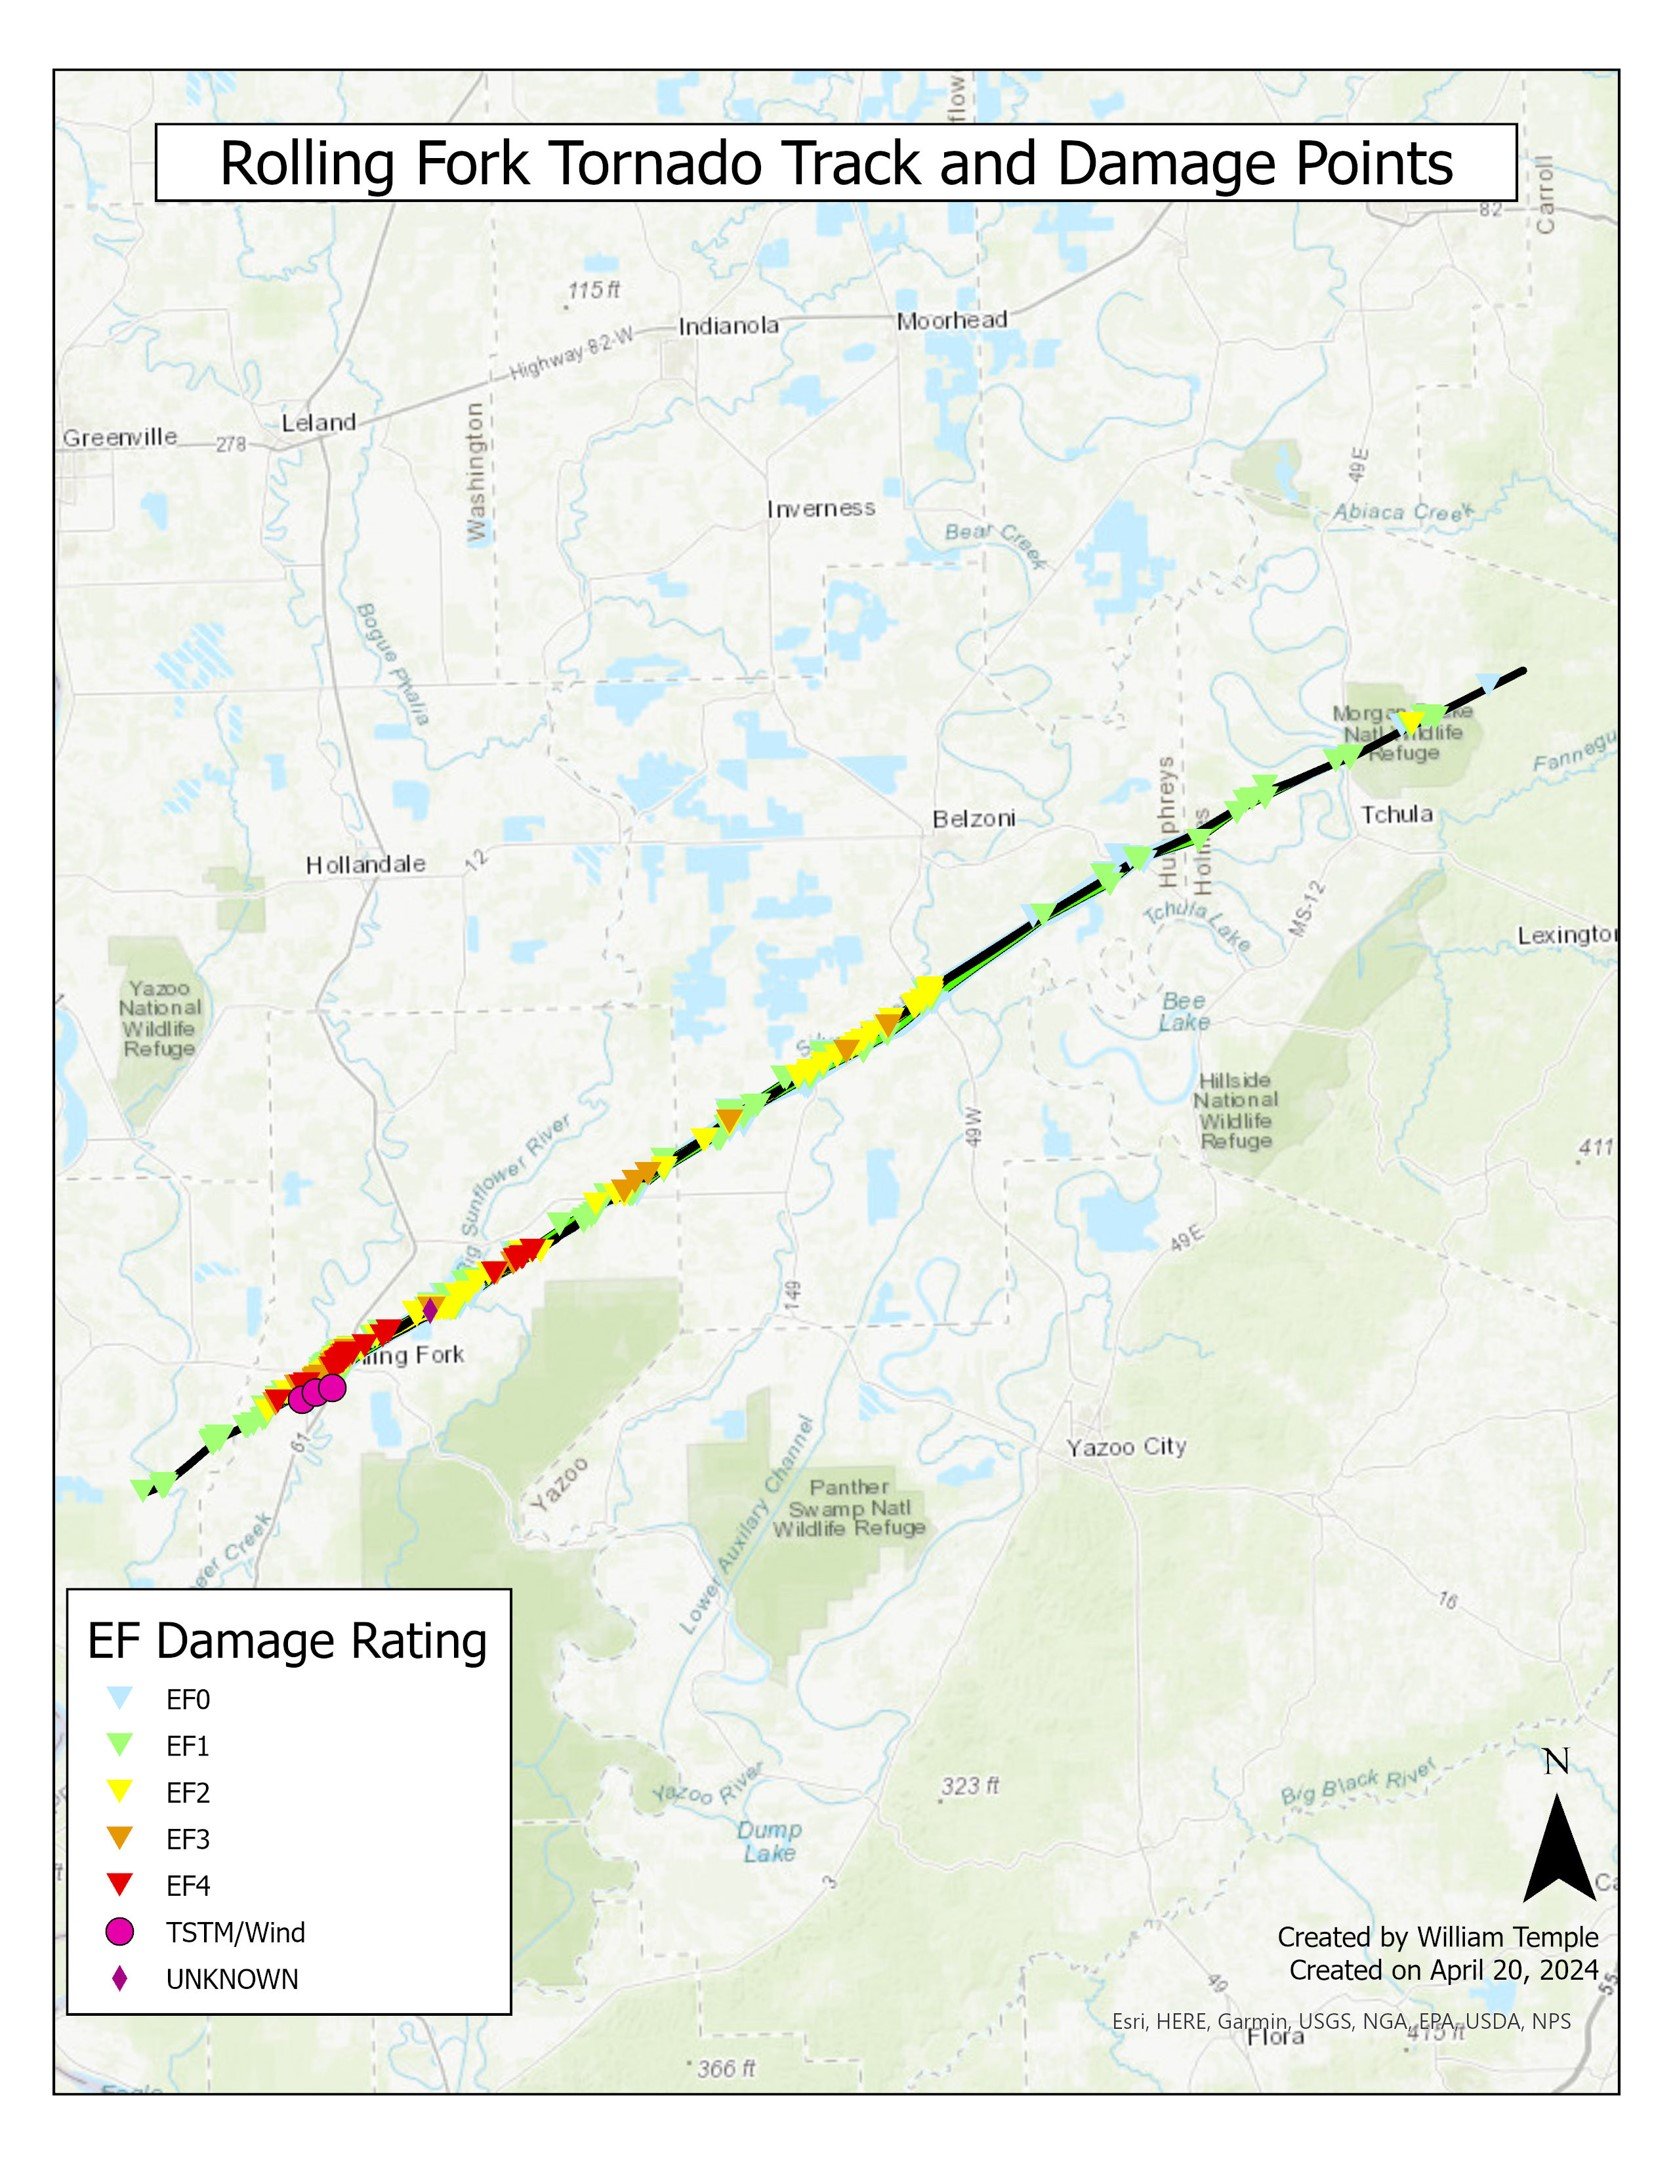
This map was part of the final project for my Remote Sensing class in Spring 2024. It illustrates the path taken by the 2023 Rolling Fork EF4 tornado as well as the points showing reported damage strength. The tornado tracked for just under 60 miles, and caused the most damage in the city of Rolling Fork, as evidenced by the clustering of "EF4" damage points.

This is a screenshot of an ArcGIS Online Experience that was my main project during my internship with Prince William County - historic maps of land tracts from the 1860s were digitized, and I compiled all of them into the Experience Builder web app so that each one can be viewed with information about its owner, date of purchase, and whether slaves were present. Click the image to view the web app!
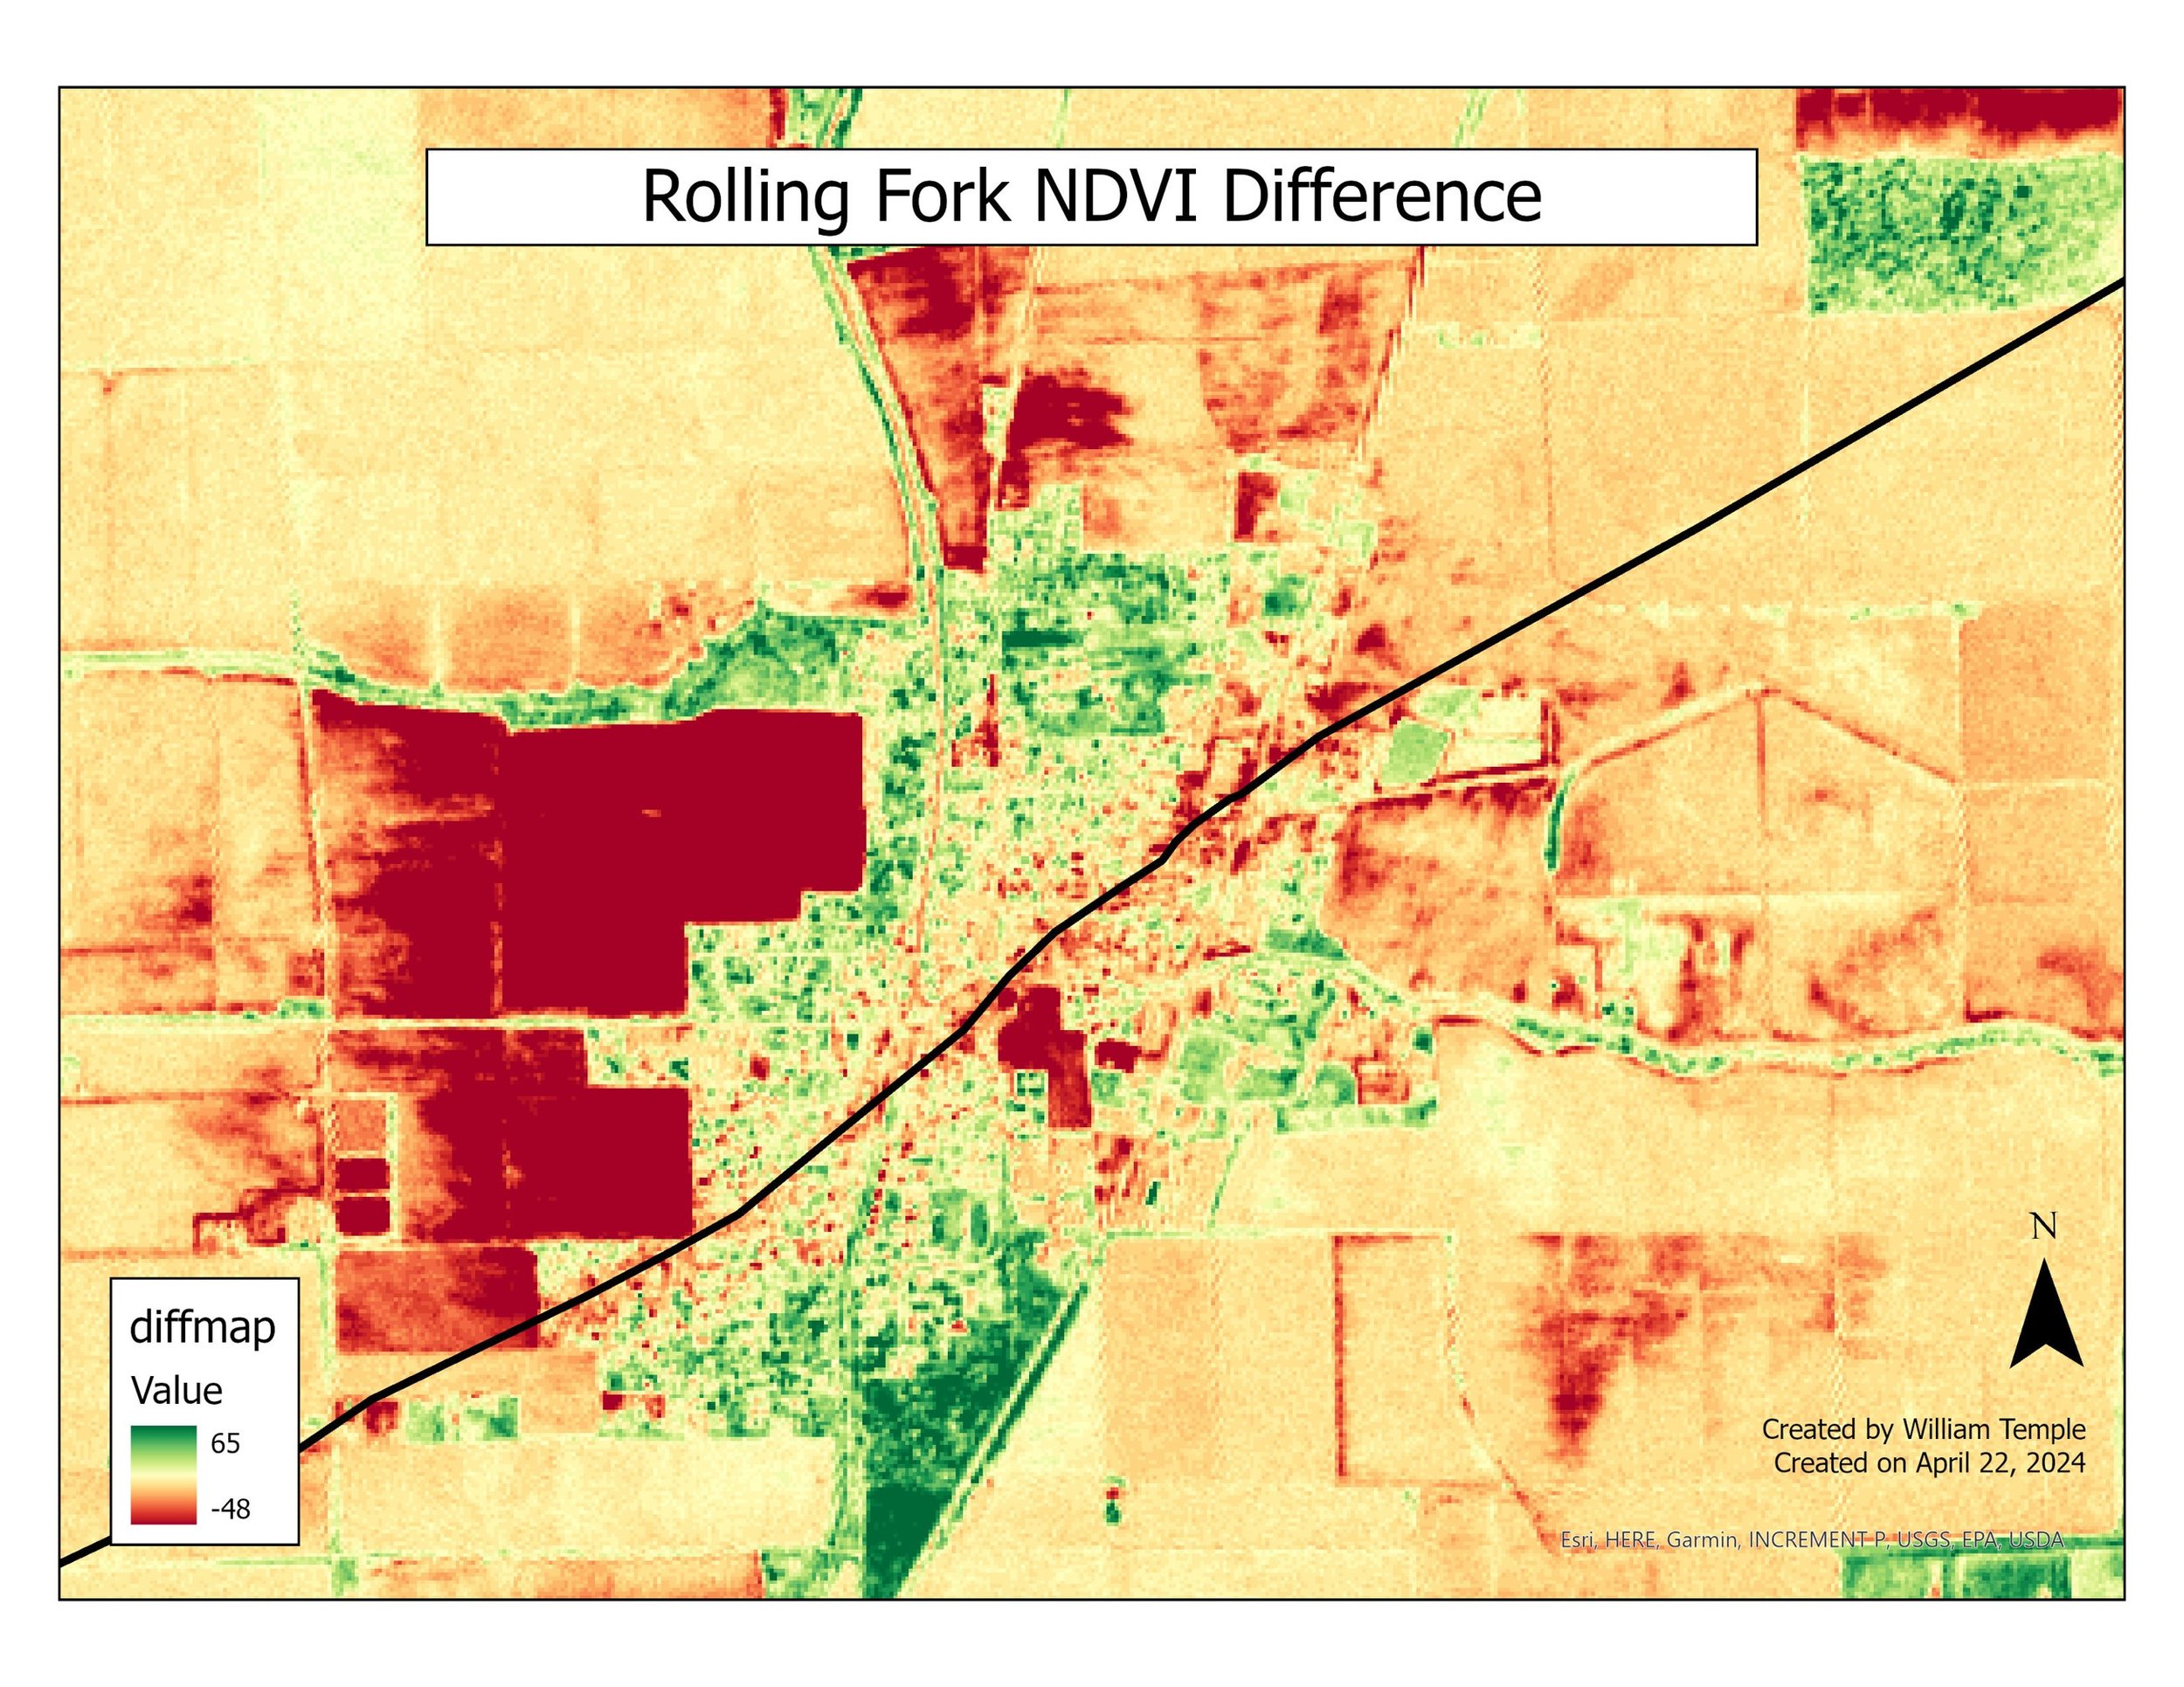
This map was also part of the final project for my Remote Sensing class in Spring 2024. I decided to analyze vegetation and infrastructure change after a strong tornado, in this case the 2023 Rolling Fork, MS EF4 tornado. I used imagery data from Sentinel 2 to create a Normalized Difference Vegetation Index (NDVI) to illustrate the overall changes in vegetation before and after the tornado, with red representing loss, and green representing gain. Polyline data of the tornado's track was obtained from the National Weather Service and added to the map for added clarity - note the overall red buffer surrounding it, showing just how powerful the tornado was.

This is a screenshot from a StoryMap I produced for my Web GIS and Programming class in Fall 2023. The date of the assignment coincided with the anniversary of the attacks of September 11, so I decided to create this app to showcase where Northern Virginia has memorials dedicated to the attacks and their victims. Click the image to view the Web App.